EXAMPLE 14 Constructing a frequency polygon
carbon
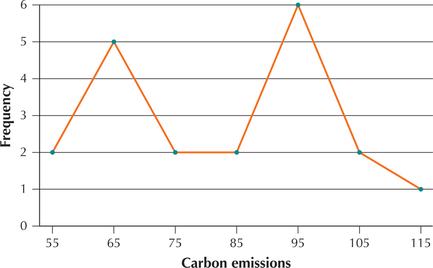
Construct a frequency polygon for the carbon emissions data in Example 12.
Solution
The midpoints for the classes are shown in Figure 19c. Plot a point for each frequency above each midpoint, and join consecutive points. The result is the frequency polygon in Figure 21.

Figure 2.21: FIGURE 21 Frequency polygon.
NOW YOU CAN DO
Exercises 53–56.