EXAMPLE 15 Constructing a stem-and-leaf display
dangerousweapons
 We will construct a stem-and-leaf display for the number of misdemeanors: dangerous weapons cases in 20 Manhattan precincts, shown here in Table 23.
| Precinct | Dangerous weapons cases | Precinct | Dangerous weapons cases |
|---|---|---|---|
| 1 | 19 | 20 | 24 |
| 5 | 24 | 22 | 9 |
| 6 | 42 | 23 | 91 |
| 7 | 79 | 24 | 22 |
| 9 | 52 | 25 | 109 |
| 10 | 21 | 26 | 67 |
| 13 | 93 | 28 | 40 |
| 17 | 12 | 32 | 90 |
| 18 | 45 | 33 | 82 |
| 19 | 23 | 34 | 88 |
Solution

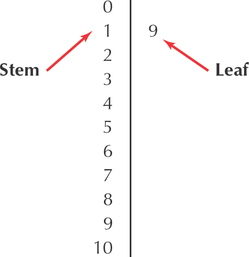
Each of these data values may be broken down into a certain number of “tens” and a certain number of “ones.” For example, take the number of dangerous weapons cases for Precinct 1: 19. Notice that , where we have 1 ten and 9 ones. Also note for Precinct , where we have 10 tens and 9 ones. For 19, the tens value is 1, whereas for 109, the tens value is 10. So we begin constructing a stem-and-leaf display by first collecting all the tens values and putting them in order in a column (Figure 22). These are called the stems.
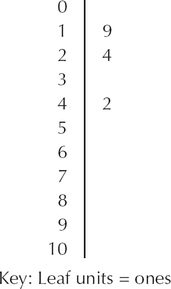
Next, consider the ones place of each data value. For example, the first data value, 19, has 1 in the tens place (the stem) and 9 in the ones place. Place this number, called the leaf, next to its stem (Figure 23).

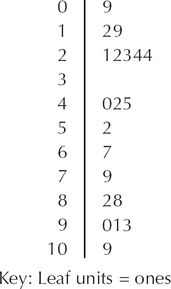
The second data value, 24, has 2 in the tens place and 4 in the ones place, and the third data value, 42, has 4 in the tens place and 2 in the ones place. Place the leaf 4 on the same line as its stem, 2, to make 24. Place the leaf 2 on the same line as its stem, 4, to make 42 (Figure 24). Continue this process with the remaining data, placing each ones value next to its stem. Then, for each stem, order the leaves from left to right in increasing order. This produces the stem-and-leaf display in Figure 25.
69


In general, the leaf units represent the smallest decimal place represented in the data values. Then, the stem unit consists of the remainder of the number. For example, suppose we have a data value of 127. Then, the 7 is the leaf unit, and the 12 is the stem. Or else, suppose our data value is 0.146. Then, our leaf unit is the 6, and the stem is the 14. Note that the stem-and-leaf display contains all the information that a histogram turned on its side contains, but it also contains more information than a histogram because the stem-and-leaf display shows the original values.
Split stems may sometimes be used in a stem-and-leaf display to provide a clearer idea of the data distribution when too many data points fall on just a few stems. When using split stems, each stem appears twice, with the leaves 0 to 4 on the upper stem and the leaves 5 to 9 on the lower stem. Figure 26 shows how the stem-and-leaf display of dangerous weapons data would appear when using split stems.
NOW YOU CAN DO
Exercises 57–60.