EXAMPLE 23 Constructing an ogive
ballattend
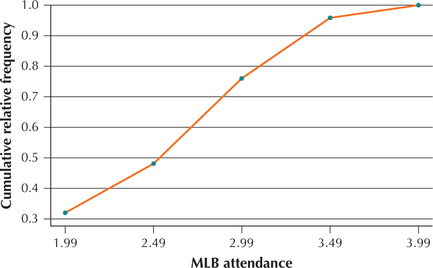
Construct a relative frequency ogive for the attendance data in Table 36.
Solution
For the x coordinates, we use the upper class limits for attendance, and for the y coordinates, we use the cumulative relative frequencies. The result is shown in Figure 47.
Page 89

FIGURE 47 Ogive for baseball attendance.
NOW YOU CAN DO
Exercises 13–16.
[Leave] [Close]