EXAMPLE 27 Omitting the zero
Student-Run Café Business
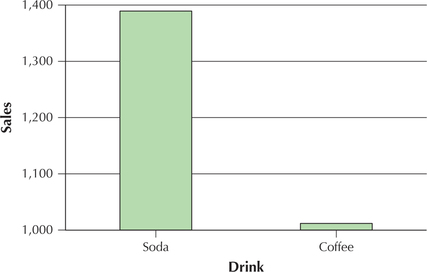
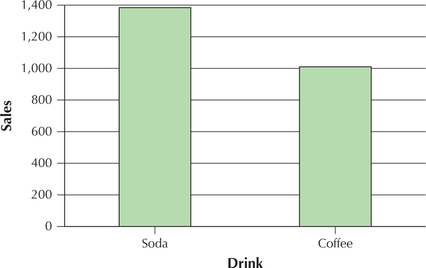
Suppose someone wanted to make the point that the students at the university with the Student-Run café business are drinking too much soda, and he or she produced Figure 55 to support this argument. Figure 55 is a bar graph of the total number of sodas sold over the 47 days compared with the total number of coffees sold. However, Figure 55 is misleading because it exaggerates the difference. Explain how Figure 55 is misleading, and produce the proper bar graph.

Solution
Figure 55 is misleading because the vertical scale does not begin at zero. Instead, as we see in Figure 56, when zero is included on the vertical scale, the difference between the numbers of soda and coffee sold is not so dramatic.
98
