EXAMPLE 28 Manipulating the scale
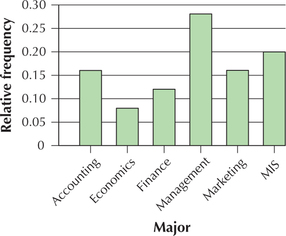
Figure 57 shows a relative frequency bar graph of the majors chosen by 25 business school students. Explain how we could manipulate the scale to de-emphasize the differences.

Figure 2.57: FIGURE 57 Well-constructed bar graph.
Solution
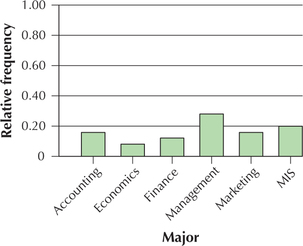
If we wanted to de-emphasize the differences, we could extend the vertical scale up to its maximum, , to produce the graph in Figure 58.

Figure 2.58: FIGURE 58 Inappropriate overextension of vertical scale.