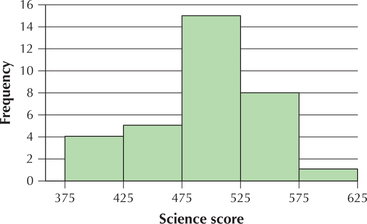
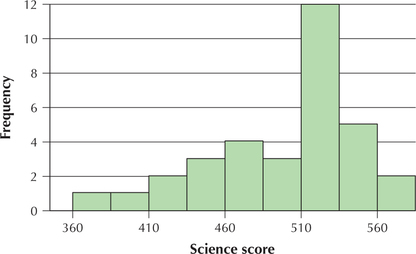
EXAMPLE 32 Presenting the same data set as both symmetric and left-skewed
The National Center for Education Statistics sponsors the Trends in International Mathematics and Science Study (TIMSS). Science tests were administered to eighth-grade students in countries around the world (see Table 46). Construct two different histograms: one that shows the data as almost symmetric and one that shows the data as left-skewed.
| Country | Score | Country | Score | Country | Score |
|---|---|---|---|---|---|
| Singapore | 578 | New Zealand | 520 | Bulgaria | 479 |
| Taiwan | 571 | Lithuania | 519 | Jordan | 475 |
| South Korea | 558 | Slovak Republic | 517 | Moldova | 472 |
| Hong Kong | 556 | Belgium | 516 | Romania | 470 |
| Japan | 552 | Russian Federation | 514 | Iran | 453 |
| Hungary | 543 | Latvia | 513 | Macedonia | 449 |
| Netherlands | 536 | Scotland | 512 | Cyprus | 441 |
| United States | 527 | Malaysia | 510 | Indonesia | 420 |
| Australia | 527 | Norway | 494 | Chile | 413 |
| Sweden | 524 | Italy | 491 | Tunisia | 404 |
| Slovenia | 520 | Israel | 488 | Philippines | 377 |
101
Solution
Figure 62 is nearly symmetric, but Figure 63 is clearly left-skewed. It is important to realize that both figures are histograms of the very same data set. Clever choices for the number of classes and the class limits can affect how a histogram presents the data. The reader must therefore beware! The histogram represents a summarization of the data set, not the data set itself. Analysts may wish to supplement the histogram with other graphical methods, such as dotplots and stem-and-leaf displays, in order to gain a better understanding of the distribution of the data.
 The One Variable Statistics and Graphs applet allows you to experiment with the class width and number of classes when constructing a histogram.

