EXAMPLE 4 Constructing a pie chart
Construct a pie chart for the app type data from Example 2.
Solution
The relative frequencies from Example 2 are shown in Table 5. We multiply each relative frequency by 360° to get the number of degrees for that section (slice) of the pie chart.
| Variable: app type | Relative frequency | Multiply by 360° | Degrees for that section |
|---|---|---|---|
| Games | 7/20=0.35 | 0.35×360°= | |
| Social networking | |||
| Music | |||
| Photo and video | |||
| Sports | |||
| Total |
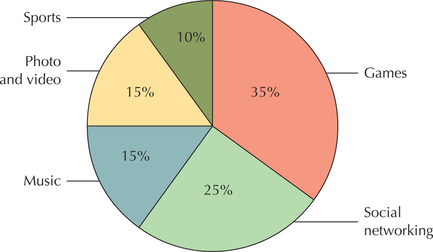
Our pie chart will have five slices—one for each app type category. Use the compass to draw a circle. Then, use the protractor to construct the appropriate angles for each section. From the center of the circle, draw a line to the top of the circle. Measure your first angle using this line. For the Games app type, we need an angle of 126°. This angle is shown in Figure 3. Then, from there, measure your second angle—in this case, the 90° right angle for Social networking apps. Continue until your circle is complete.
NOW YOU CAN DO
Exercises 19, 20, 35, and 36.