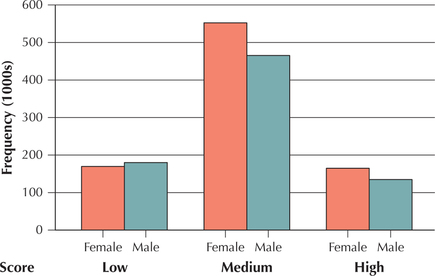
EXAMPLE 7 Clustered bar graphs
Use the tabular data in Table 8 to construct a clustered bar chart of SAT Writing exam scores clustered by gender.
Solution
Gender is given as the clustering variable. Thus, for each category of the variable SAT Writing exam score, we will draw two bars: one representing females and the other representing males. For the first category, Low = SAT score between 200 and 390, we draw the female rectangle going up to 169.314 (because Figure 5 is given in 1000s), and we draw the male rectangle going up to 178.606. These two rectangles should touch each other but should not touch any other rectangles. Continue to draw two rectangles for each SAT score category: one for each of the females' and males' frequencies. The resulting clustered bar graph is shown here as Figure 5. We say that the Writing exam scores are clustered by gender. (Note: Medium = .)

NOW YOU CAN DO
Exercises 57–60.