Open the data set Titanic. Use technology for Exercises 125–130.
Question 2.129
titanic
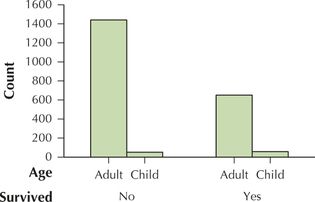
129. Construct a clustered bar graph of the variable survived clustered by age. Did you stand a better chance of surviving as an adult or a child?
2.1.129

A child.