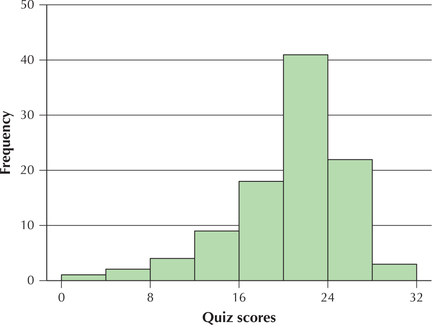
Figure 44 shows a histogram of a set of statistics quiz scores. Use this information for Exercises 71–74.

FIGURE 44 Quiz scores.
Question 2.209
72. Between which two scores did the most quiz scores occur?
[Leave] [Close]
Figure 44 shows a histogram of a set of statistics quiz scores. Use this information for Exercises 71–74.

72. Between which two scores did the most quiz scores occur?