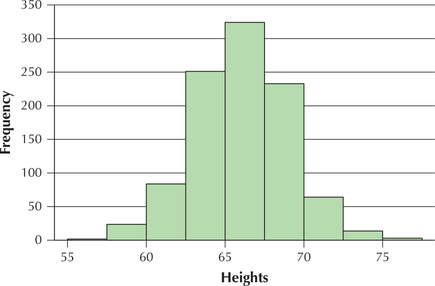
Figure 45 shows a histogram of a set of women's heights. Use this information for Exercises 75–78.

Figure 2.45: FIGURE 45 Women's heights.
Question 2.213
76. Between which two values did the most heights occur?
Figure 45 shows a histogram of a set of women's heights. Use this information for Exercises 75–78.

76. Between which two values did the most heights occur?