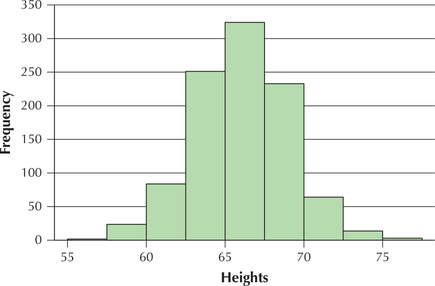
Figure 45 shows a histogram of a set of women's heights. Use this information for Exercises 75–78.

Figure 2.45: FIGURE 45 Women's heights.
Question 2.214
77. If we added one inch to every woman's height, how would Figure 45 change?
2.2.77
The scale on the -axis would shift up by 1 inch.