Question 2.222
brooklynfrauds2000
85. Frauds in brooklyn in 2000. Table 30 provides the number of misdemeanor fraud cases in each of Brooklyn's 23 police precincts in 2000.
Table 2.72: TABLE 30 Fraud cases in Brooklyn precincts, 2000
| Precinct | Frauds | Precinct | Frauds |
|---|---|---|---|
| 40 | 60 | 75 | 198 |
| 41 | 198 | 76 | 45 |
| 42 | 92 | 77 | 83 |
| 43 | 109 | 78 | 33 |
| 44 | 79 | 79 | 156 |
| 45 | 240 | 81 | 69 |
| 46 | 130 | 83 | 78 |
| 47 | 89 | 84 | 54 |
| 48 | 210 | 88 | 107 |
| 49 | 89 | 90 | 45 |
| 50 | 103 | 94 | 46 |
| 52 | 95 |
82
- Use 7 classes of width 40 each, starting at the leftmost class: 0 to < 40. Find the frequencies for each class.
- Find the relative frequencies for each class.
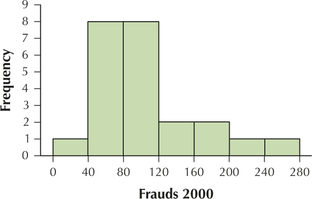
- Construct a frequency histogram of the number of fraud cases in Brooklyn in 2000.
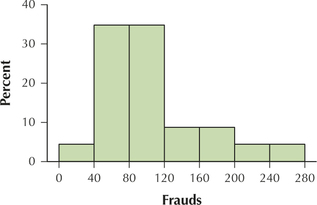
- Construct a relative frequency histogram of the number of fraud cases in Brooklyn in 2000.
2.2.85
(a) and (b)
| Frauds | Frequency | Relative frequency |
|---|---|---|
| 0 to < 40 | 1 | 1/23 = 0.0435 |
| 40 to < 80 | 8 | 8/23 = 0.3478 |
| 80 to < 120 | 8 | 8/23 = 0.3478 |
| 120 to < 160 | 2 | 2/23 = 0.0870 |
| 160 to < 200 | 2 | 2/23 = 0.0870 |
| 200 to < 240 | 1 | 1/23 = 0.0435 |
| 240 to < 280 | 1 | 1/23 = 0.0435 |
| Total | 23 | 23/23 = 1.0000 |
(c)

(d)
