Question 2.228
coffees
91. Coffee Sales for the Student-Run Café. In Table 32, we see the number of coffees sold per day for the Student-Run café business. Consider this to be continuous data.
Table 2.75: TABLE 32 Coffees sold per day
| 41 | 30 | 21 | 25 | 21 | 4 |
| 33 | 27 | 28 | 35 | 8 | 13 |
| 34 | 30 | 23 | 33 | 8 | 4 |
| 27 | 27 | 31 | 35 | 4 | 16 |
| 20 | 26 | 29 | 16 | 4 | 14 |
| 23 | 24 | 48 | 24 | 3 | 10 |
| 32 | 18 | 25 | 20 | 5 | 11 |
| 31 | 22 | 31 | 11 | 6 |
- Use 7 classes of width 8 each, starting with the following leftmost class: 0 to < 8. Calculate the class boundaries.
- Find the frequencies for each class.
- Find the relative frequencies for each class.
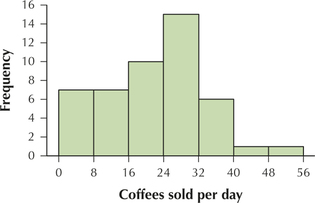
- Construct a frequency histogram of coffees sold.
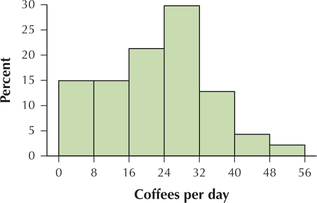
- Construct a relative frequency histogram of coffees sold.
83
2.2.91
(a), (b), (c)
| Coffee sold per day | Frequency | Relative frequency |
|---|---|---|
| 0 to < 8 | 7 | 7/47 = 0.1489 |
| 8 to < 16 | 7 | 7/47 = 0.1489 |
| 16 to < 24 | 10 | 10/47 = 0.2128 |
| 24 to < 32 | 15 | 15/47 = 0.3191 |
| 32 to < 40 | 6 | 6/47 = 0.1277 |
| 40 to < 48 | 1 | 1/47 = 0.0213 |
| 48 to < 56 | 1 | 1/47 = 0.0213 |
| Total | 47 | 47/47 = 1.0000 |
(d)

(e)
