Number of Businesses. Use the following data for Exercises 117–120. The data represent the number of business establishments in a sample of states.
| State | Businesses (1000s) |
State | Businesses (1000s) |
|---|---|---|---|
| Alabama | 3.8 | Michigan | 7.5 |
| Arizona | 7.9 | Minnesota | 6.1 |
| Colorado | 8.9 | Missouri | 5.9 |
| Connecticut | 3.1 | Ohio | 9.5 |
| Georgia | 10.3 | Oklahoma | 3.8 |
| Illinois | 11.9 | Oregon | 5.4 |
| Indiana | 5.6 | South Carolina | 4.6 |
| Iowa | 2.7 | Tennessee | 5.4 |
| Maryland | 5.7 | Virginia | 8.6 |
| Massachusetts | 6.3 | Washington | 9.3 |
Table 2.79: Source: U.S. Census Bureau.
Question 2.254
statebusinesses
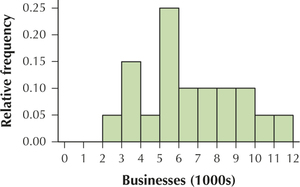
117. Construct the following:
- A frequency distribution
- A relative frequency distribution
- A relative frequency histogram
2.2.117
(a) and (b)
| Businesses (1000s) | Frequency | Relative frequency |
|---|---|---|
| 2 to < 3 | 1 | 1/20 = 0.05 |
| 3 to < 4 | 3 | 3/20 = 0.15 |
| 4 to < 5 | 1 | 1/20 = 0.05 |
| 5 to < 6 | 5 | 5/20 = 0.25 |
| 6 to < 7 | 2 | 2/20 = 0.10 |
| 7 to < 8 | 2 | 2/20 = 0.10 |
| 8 to < 9 | 2 | 2/20 = 0.10 |
| 9 to < 10 | 2 | 2/20 = 0.10 |
| 10 to < 11 | 1 | 1/20 = 0.05 |
| 11 to < 12 | 1 | 1/20 = 0.05 |
| Total | 20 | 20/20 = 1.00 |
(c)
