Question 2.295
harassment
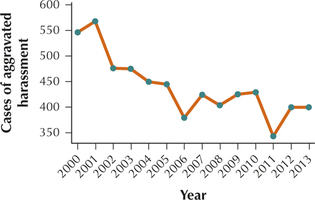
17.  The following time series data represent the number of aggravated harassment cases handled by New York City Police Precinct 1 from 2000 to 2013.
- Construct the time series graph of the data.
- Describe any patterns you see.
| Year | 2000 | 2001 | 2002 | 2003 | 2004 | 2005 | 2006 |
|---|---|---|---|---|---|---|---|
| Cases | 547 | 568 | 476 | 475 | 450 | 445 | 379 |
| Year | 2007 | 2008 | 2009 | 2010 | 2011 | 2012 | 2013 |
| Cases | 424 | 404 | 425 | 429 | 343 | 400 | 400 |
2.3.17
(a)

(b) Generally decreasing