Question 2.299
maunaloa2
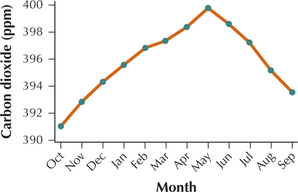
21. Atmospheric Carbon Dioxide. Table 39 contains the amount of carbon dioxide in parts per million (ppm) found in the atmosphere above Mauna Loa, Hawaii, measured monthly from October 2012 to September 2013.
- Construct a time series plot of these data.
- Describe the pattern you see.
Table 2.93: TABLE 39 Atmospheric carbon dioxide at Mauna Loa, October 2012 to September 2013
| Month | Carbon dioxide (ppm) |
Month | Carbon dioxide (ppm) |
|---|---|---|---|
| Oct. | 391.01 | Apr. | 398.35 |
| Nov. | 392.81 | May | 399.76 |
| Dec. | 394.28 | June | 398.58 |
| Jan. | 395.54 | July | 397.20 |
| Feb. | 396.80 | Aug. | 395.15 |
| Mar. | 397.31 | Sept. | 393.51 |
Table 2.93: Source: Dr. Pieter Tans, Earth System Research Laboratory, National Oceanic and Atmospheric Administration, www.esrl.noaa.gov/gmd/ccgg/trends.
2.3.21
(a)

(b) The level of carbon dioxide increases from October to May and decreases from May to September.