Question 2.305
percapitaincome
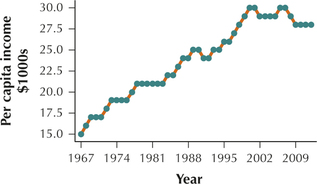
27. Per Capita Income. The following data represent the per capita income in the United States from 1967 to 2012, in thousands of constant (2012) dollars.
| Year | Per capita income $1000s |
Year | Per capita income $1000s |
Year | Per capita income $1000s |
|---|---|---|---|---|---|
| 1967 | 15 | 1983 | 21 | 1998 | 28 |
| 1968 | 16 | 1984 | 22 | 1999 | 29 |
| 1969 | 17 | 1985 | 22 | 2000 | 30 |
| 1970 | 17 | 1986 | 23 | 2001 | 30 |
| 1971 | 17 | 1987 | 24 | 2002 | 29 |
| 1972 | 18 | 1988 | 24 | 2003 | 29 |
| 1973 | 19 | 1989 | 25 | 2004 | 29 |
| 1974 | 19 | 1990 | 25 | 2005 | 29 |
| 1975 | 19 | 1991 | 24 | 2006 | 30 |
| 1976 | 19 | 1992 | 24 | 2007 | 30 |
| 1977 | 20 | 1993 | 25 | 2008 | 29 |
| 1978 | 21 | 1994 | 25 | 2009 | 28 |
| 1979 | 21 | 1995 | 26 | 2010 | 28 |
| 1980 | 21 | 1996 | 26 | 2011 | 28 |
| 1981 | 21 | 1997 | 27 | 2012 | 28 |
| 1982 | 21 |
Table 2.97: Source: U.S. Census Bureau.
- Construct a time series plot of the per capita income.
- A fairly constant increasing trend occurs. In what year does this trend appear to end?
2.3.27
(a)

(b) 2008