Question 2.309
miamideptcorrections
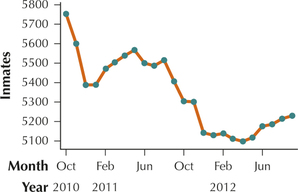
31. Miami arrests. The Miami-Dade Department of Corrections and Rehabilitation publishes its monthly average daily population of inmates in its Annual Report. Table 43 shows the average daily number of inmates from October 2010 through September 2012. Construct a time series graph of the data.
Table 2.100: TABLE 43 Average monthly inmate population, Miami-Dade Department of Corrections
| Month | Inmates | Month | Inmates | Month | Inmates |
|---|---|---|---|---|---|
| Oct 2010 | 5753 | Jun 2011 | 5500 | Feb 2012 | 5138 |
| Nov 2010 | 5600 | Jul 2011 | 5486 | Mar 2012 | 5111 |
| Dec 2010 | 5387 | Aug 2011 | 5515 | Apr 2012 | 5097 |
| Jan 2011 | 5388 | Sep 2011 | 5406 | May 2012 | 5117 |
| Feb 2011 | 5471 | Oct 2011 | 5304 | Jun 2012 | 5175 |
| Mar 2011 | 5504 | Nov 2011 | 5201 | Jul 2012 | 5185 |
| Apr 2011 | 5538 | Dec 2011 | 5141 | Aug 2012 | 5214 |
| May 2011 | 5567 | Jan 2012 | 5129 | Sept 2012 | 5229 |
Table 2.100: Source: www.miamidade.gov/corrections/library/Annual-Report-2011-2012.pdf.
2.3.31
