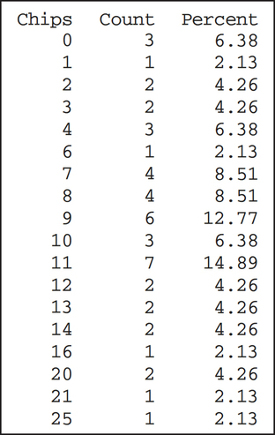
Student-Run Café Business. Use the Minitab relative frequency distribution of potato chip sales for Exercises 12–14. The distribution shows the number of days each number of chips was sold. For example, four bags of chips were sold on three different days.

Minitab relative frequency distribution of potato chip sales
Question 2.343
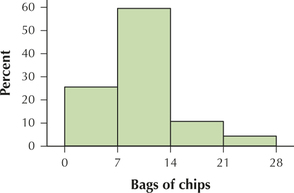
13. Use the relative frequency distribution to construct a histogram of potato chip sales.
2.99.13
