Question 2.353
tradedeficits
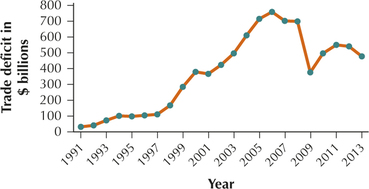
23. Trade Deficit. Table 47 presents the annual trade deficits (imports minus exports) for the United States from 1991 to 2013, in billions of dollars.
- Construct a time series plot of the data.
- Describe any trends that you see.
Table 2.109: TABLE 47 U.S. trade deficits
| Year | Trade deficit in $ billions |
Year | Trade deficit in $ billions |
|---|---|---|---|
| 1991 | 31 | 2003 | 494 |
| 1992 | 39 | 2004 | 609 |
| 1993 | 70 | 2005 | 714 |
| 1994 | 98 | 2006 | 759 |
| 1995 | 96 | 2007 | 702 |
| 1996 | 104 | 2008 | 698 |
| 1997 | 108 | 2009 | 374 |
| 1998 | 166 | 2010 | 495 |
| 1999 | 264 | 2011 | 548 |
| 2000 | 379 | 2012 | 538 |
| 2001 | 364 | 2013 | 476 |
| 2002 | 421 |
Table 2.109: Source: U.S. Census Bureau.
2.99.23
(a)

(b) The trade deficit generally increased from 1991 to 2006, then it generally decreased from 2006 until 2009, then it increased from 2009 until 2011, and then it decreased from 2011 to 2013.