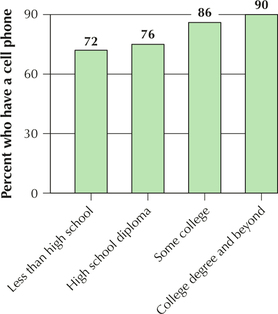
Cell Phone Ownership. Figure 14 shows the percentage of cell phone ownership categorized by level of education.3 Use Figure 14 to answer Exercises 77 and 78.

Figure 2.14: FIGURE 14 Cell phone ownership.
Question 2.77
77. Can we use the information in Figure 14 to construct a pie chart? Explain why or why not.
2.1.77
No. There are actually two categorical variables—level of education and whether or not the person owns a cell phone. The percents are percents of each category of level of education who own cell phones and not the percent of the whole group who own cell phones.