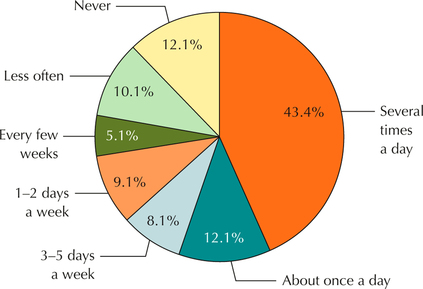
Cell Phones and the Internet. Figure 15 is a pie chart representing the percentage of Americans who access the Internet or email using their cell phones. Use Figure 15 to answer Exercises 79 and 80.
Question 2.79
79. According to this survey:
- What is the most common response? What percentage does this represent?
- What is the least common response? What percentage does this represent?
56
 Figure 2.15: FIGURE 15 Percentage using cell phones for Internet or email.4
2.1.79
(a) Several times a day; 43.4% (b) Every few weeks; 5.1%