Question 2.83
cartypemodel
83. Table 16 shows the numbers of vehicle models, which are categorized by vehicle type, examined each year by the U.S. Department of Energy to determine vehicle gas mileage. Use Table 16 to construct the following:
- Relative frequency distribution
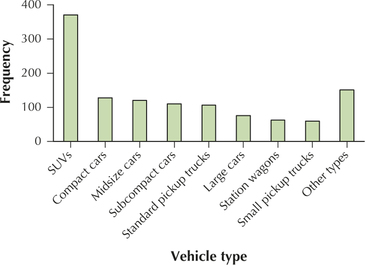
- Frequency bar graph
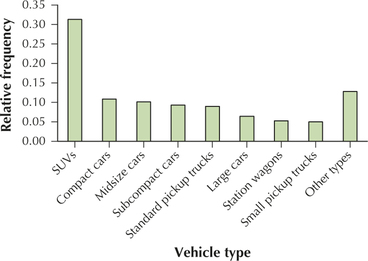
- Relative frequency bar graph
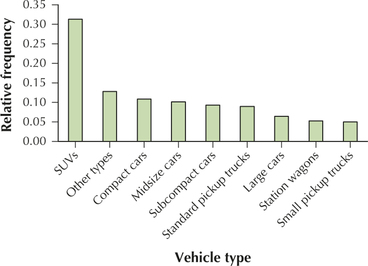
- Pareto chart, using relative frequencies
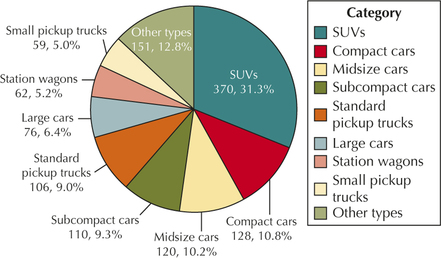
- Pie chart of the relative frequencies
Table 2.32: TABLE 16 Frequency distribution of vehicle type
| Vehicle type | Number of models |
|---|---|
| SUVs | 370 |
| Compact cars | 128 |
| Midsize cars | 120 |
| Subcompact cars | 110 |
| Standard pickup trucks | 106 |
| Large cars | 76 |
| Station wagons | 62 |
| Small pickup trucks | 59 |
| Other types | 151 |
| Total | 1182 |
2.1.83
(a) Relative frequency distribution of vehicle type
| Vehicle type | Relative frequency |
|---|---|
| SUVs | 0.3130 |
| Compact cars | 0.1083 |
| Midsize cars | 0.1015 |
| Subcompact cars | 0.0931 |
| Standard pickup trucks | 0.0897 |
| Large cars | 0.0643 |
| Station wagons | 0.0525 |
| Small pickup trucks | 0.0499 |
| Other types | 0.1277 |
| Total | 1.0000 |
(b)

(c)

(d)

(e)
