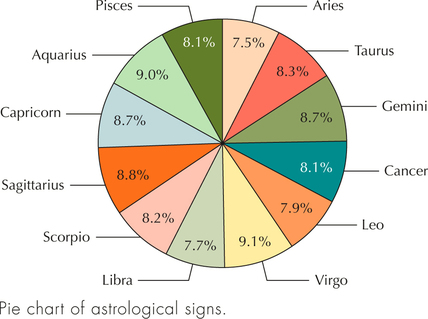
Astrological Signs. Use the following information for Exercises 90–92. The General Social Survey collects data on social aspects of life in America. Here, 1464 respondents reported their astrological signs. A pie chart of the results is shown below.

Pie chart of astrological signs.
Question 2.91
91. Use the percentages in the pie chart to do the following:
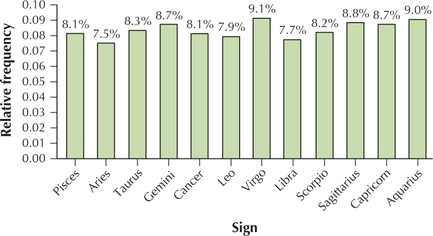
- Construct a relative frequency bar graph of the astrological signs.
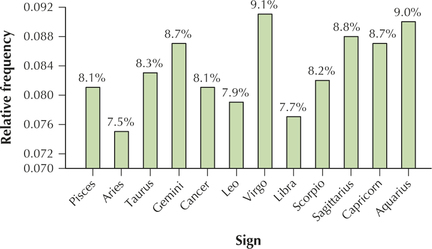
- Construct a relative frequency bar graph, but, this time, have the y axis begin at 7% instead of zero. Describe the difference between the two bar graphs. When would this one be used as opposed to the earlier bar graph?
2.1.91
(a)

(b)

The graph in (b) uses an adjusted scale, which is misleading. Use this graph to magnify the small variability in percentages.