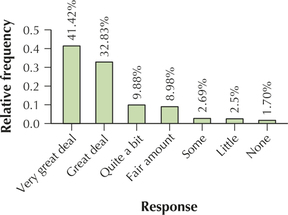
Satisfaction with Family life. Use the following information for Exercises 93–95. The General Social Survey also asked respondents about their amount of satisfaction with family life. Here, 1002 respondents reported their satisfaction levels with family life, as shown in the frequency distribution below.
| Satisfaction | Frequency |
|---|---|
| Very great deal | 415 |
| Great deal | 329 |
| Quite a bit | 99 |
| A fair amount | 90 |
| Some | 27 |
| A little | 25 |
| None | 17 |
| Total | 1002 |
Question 2.93
satisfaction
93. Construct a Pareto graph of the categories. Do you think that, overall, people are happy with their family lives?
2.1.93

Categories are qualitative; interpretation will vary.