EXAMPLE 34 Constructing a boxplot by hand
Construct a boxplot by hand for the export data.
Solution
From Example 31, the fve-number summary for the state export data is Min=1.6, Q1=3.4, Med=4.65, Q3=5.4, Max=7.7. The interquartile range for the state export data is IQR=Q3-Q1=5.4-3.4=2.0.
- Step 1 Determine the lower and upper fences:
- Lower fence=Q1-1.5(IQR)=3.4-1.5(2)=0.4
- Upper fence=Q3+1.5(IQR)=5.4+1.5(2)=8.4
- Step 2 Draw a horizontal number line that encompasses the range of your data, including the fences. Above the number line, draw vertical lines at Q1=3.4, median=4.65, and Q3=5.4. Connect the lines for Q1 and Q3 to each other so as to form a box, as shown in Figure 35a.
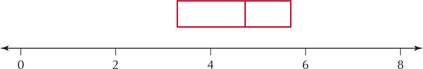 FIGURE 35A Constructing a boxplot by hand: Steps 1 and 2.
 - Step 3 Temporarily indicate the fences (lower fence=0.4 and upper fence=8.4) as brackets above the number line. (See Figure 35b.)
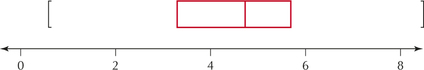 FIGURE 35B Constructing a boxplot by hand: Step 3.
 - Step 4 Draw a horizontal line from Q1=3.4 to the smallest data value greater than the lower fence. The lowest data value is min=1.6. This is greater than the lower fence=0.4, so draw the line from 3.4 to 1.6. Draw a horizontal line from Q3=5.4 to the largest data value smaller than the upper fence. The largest data value is Max=7.7, which is smaller than the upper fence, so draw the line from 5.4 to 7.7. (See Figure 35c.)Page 175
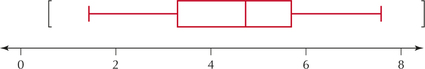 FIGURE 35C Constructing a boxplot by hand: Step 4.
 - Step 5 No data values are lower than the lower fence or greater than the upper fence. Thus, no outliers exist in this data set. Therefore, simply remove the temporary brackets, and the boxplot is complete, as shown in Figure 35d.
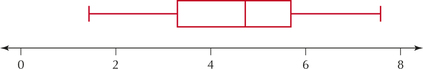 FIGURE 35D The completed boxplot.
NOW YOU CAN DO
Exercises 9–10, 15–16, and 21–22.
[Leave] [Close]