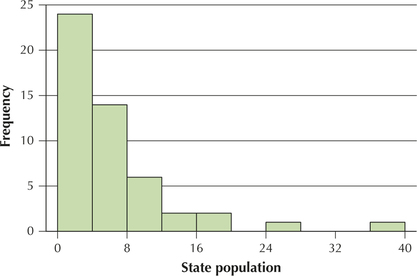
EXAMPLE 35 Boxplot for right-skewed data
The population of the 50 U.S. states in 2013 (Source: U.S. Census Bureau) is a right-skewed distribution, as shown in the histogram of the data in Figure 36, where the results are shown in millions of people living in the state. The fve-number summary is Min=0.6, Q1=1.8, Med=4.5, Q3=7.1, and Max=37.7. Note that, in the right-skewed boxplot (Figure 37), the upper whisker is much longer than the lower whisker. Also, it is often the case that the median is closer to Q1 than to Q3 in right-skewed data, but that didn't happen with this data.
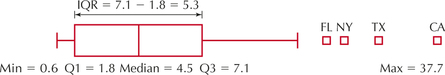
The four little boxes at the right represent outliers. (The TI-83/84 uses little boxes instead of asterisks.) These states are California, Texas, New York, and Florida. When no outliers exist, the whiskers extend as far as the minimum and maximum values. However, when outliers exist, the whiskers extend only as far as the most extreme data value that is not an outlier.