EXAMPLE 36 Boxplot for left-skewed data
Figure 38 is a histogram of 650 exam scores. Clearly, the data are left-skewed, with many students getting scores in the 90s and fewer getting grades in the 70s or 80s.
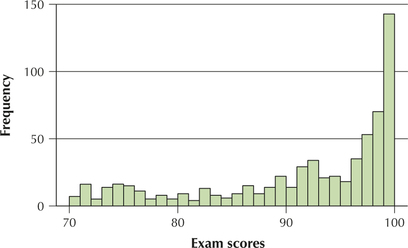
FIGURE 38 Histogram of exam scores.
Solution
The fve-number summary is Min=70, Q1=86, Med=94, Q3=98, and Max=100. So, this time, with left-skewed data, the median is closer to Q3 than to Q1. Bet you guessed it!
In the boxplot (Figure 39), notice that the median (94) is closer to the upper hinge (Q3, 98) than to the lower hinge (Q1, 86), and the lower whisker is much longer than the upper whisker. This combination of characteristics indicates a left-skewed data set.
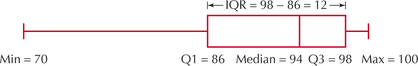
FIGURE 39 TI-83/84 boxplot of the exam scores.
NOW YOU CAN DO
Exercises 25 and 26.
[Leave] [Close]