EXAMPLE 37 IQR method for detecting outliers
Table 27 contains the value of exports by the United States to a sample of 12 countries around the world. Determine if there are any outliers in the country export data.
| Country | U.S. exports ($ millions) |
|---|---|
| Italy | 1.2 |
| Saudi Arabia | 1.7 |
| India | 1.9 |
| France | 2.8 |
| Brazil | 3.5 |
| South Korea | 3.8 |
| United Kingdom | 4.4 |
| Germany | 4.5 |
| Japan | 5.6 |
| China | 9.7 |
| Mexico | 20.3 |
| Canada | 26.3 |
Solution
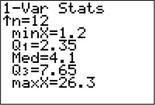
The TI 1-Var Stats analysis provides the five-number summary shown in Figure 41.
Using these statistics, we calculate the IQR to be Q3-Q1=7.65-2.35=5.3. The quantity 1.5(IQR)=1.5(5.3)=7.95. We next find the two quantities Q1-1.5(IQR) and Q3+1.5(IQR):
Q1-1.5(IQR)=2.35-7.95=−5.6Q3+1.5(IQR)=7.65+7.95=15.6
Thus, for this data set, a data value would be an outlier if it were –5.6 or less or 15.6 or more. No data values are —5.6 or less. However, both Mexico (20.3) and Canada (26.3) have values greater than 15.6. Therefore, both the $20.3 million in exports to Mexico and the $26.3 in exports to Canada may be considered outliers, using the IQR method.
NOW YOU CAN DO
Exercises 11–12, 17–18, and 23–24.