EXAMPLE 38 Comparison boxplots: Comparing body temperatures for women and men
Determine whether the body temperatures of women or men exhibit greater variability.
Solution
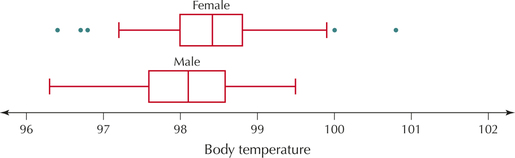
Consider the comparison boxplots in Figure 42. The box for females (on top) lies slightly to the right of that for the males, meaning that the frst quartile, the median, and the third quartile are each higher for the women than the men. Therefore, the middle 50% of the body temperatures is higher for women than for men.
We will formally test whether a difference exists in the true mean body temperature between women and men in Chapter 10.
This figure seems to offer some evidence that the mean body temperature for women may be higher than that for men. The location of the box is an indication of the center of the data, but where would we look for a difference in the variability of body temperatures between women and men? From Figure 43, for the females we have
IQR=Q3-Q1=98.8-98.0=0.8.
For the males, we have
IQR=Q3-Q1=98.6-98.6=1.0.
Therefore, the IQR for males is greater.
Let's determine which data set has greater variability based on the three different measures of spread that we have learned: the range, the standard deviation, and the IQR.
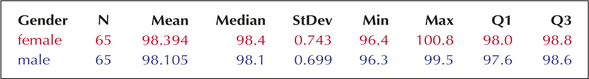
Range for women = 100.8−96.4=4.4Standard deviation for women = 0.743IQR for women = 0.8Range for men = 99.5−96.3=3.2Standard deviation for men = 0.699IQR for men = 1.0
NOW YOU CAN DO
Exercises 27–30.