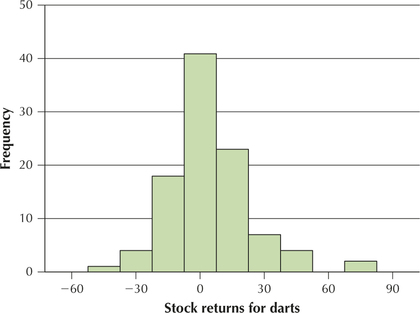
 Darts and the DJIA. Refer to the darts and DJIA data in Exercises 43 and 44 for Exercises 53–56.
Question 3.167
54. The histogram shows the population distribution of the stock market changes for the darts. Can we live with the assumption that the distribution is bell-shaped?
