 Financial Experts versus the Darts. This set of exercises uses the Darts data set from the Chapter 3 Case Study to examine the methods and techniques we have learned in this section. Open the Darts data set. Use technology to do the following in Exercises 58–63.
Question 3.434
darts
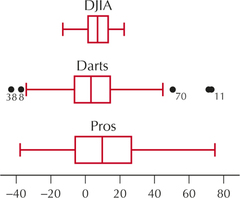
59. Construct a comparison boxplot of all three groups. From the boxplot, which group has the greatest variability? The smallest variability?
3.5.59

Pros has the greatest variability, DJIA has the smallest.
[Leave] [Close]