EXAMPLE 12 Calculating SSE, the sum of squares error
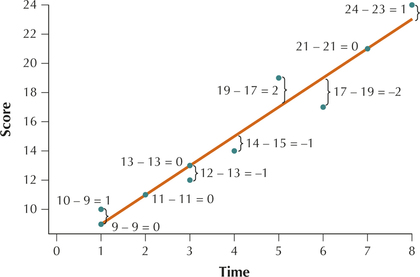
- Construct a scatterplot of the memory score data, indicating each residual.
- Calculate SSE for the memory score data.
Solution
- The brackets (}) in the scatterplot in Figure 32 indicate the residual for each student’s score. The quantities represented by these brackets are the residuals .
Table 7 shows the -values and residuals for the data in Table 6. The SSE is then found by squaring each residual and taking the sum. Thus,
We know that is the regression line, according to the least-squares criterion, so no other possible straight line would result in a smaller SSE.
 Figure 4.32: FIGURE 32 Scatterplot showing the prediction errors or residuals .
Table 4.68: Table 7 Calculation of the SSE for the short-term memory test example
| Student | Time | Actual score |
Predicted score |
Residual |
(Residual)2 |
|---|---|---|---|---|---|
| 1 | 1 | 9 | 9 | 0 | 0 |
| 2 | 1 | 10 | 9 | 1 | 1 |
| 3 | 2 | 11 | 11 | 0 | 0 |
| 4 | 3 | 12 | 13 | −1 | 1 |
| 5 | 3 | 13 | 13 | 0 | 0 |
| 6 | 4 | 14 | 15 | −1 | 1 |
| 7 | 5 | 19 | 17 | 2 | 4 |
| 8 | 6 | 17 | 19 | −2 | 4 |
| 9 | 7 | 21 | 21 | 0 | 0 |
| 10 | 8 | 24 | 23 | 1 | 1 |
NOW YOU CAN DO
Exercises 11a–22a.