EXAMPLE 8 Correlation and regression using technology
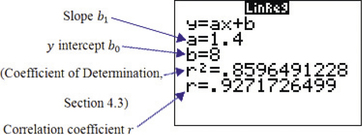
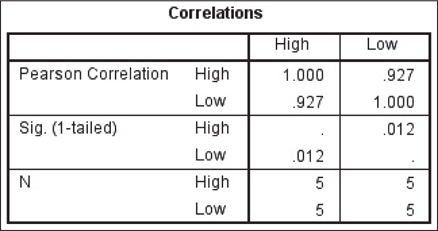
Use technology to find the correlation coefficient and the regression coefficients and for the temperature data in Table 3 (page 193).
Solution
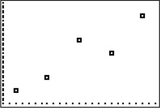
The instructions for using technology for correlation and regression are provided in the Step-by-Step Technology Guide at the end of this section (page 217). The TI-83/84 scatterplot is shown in Figure 19, and the TI-83/84 results are shown in Figure 20. (Note that the TI-83/84 indicates the slope as , and the intercept as .) Figures 21 and 22 show the Excel results, with the intercept (“Intercept”) and the slope (“Low”) highlighted. Figures 23 and 24 show excerpts from the Minitab results, with the intercept (“Constant”) and the slope (“Low”) highlighted. Figures 25 and 26 show excerpts from the SPSS results.


213

