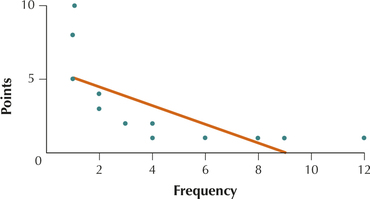
Invalid Application of Linear Regression. Use the information in the following scatterplot for Exercises 62–64. Scrabble (hasbro.com/scrabble/en_US/) is one of the most popular games in the world. We are interested in approximating the relationship between the frequency of the letter tiles in the game and their point value . The scatterplot shows the point value versus the letter frequency, along with the regression line, as plotted by Minitab.
223

Scatterplot of Scrabble point value versus letter frequency, with regression line.
Question 4.160
62. Does the relationship between frequency and points seem to be positive or negative?