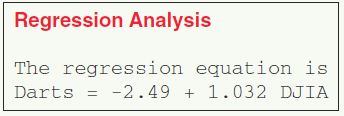
Chapter 3 Case Study (Continued). Use the following information for Exercises 65–68. Shown here is the regression equation for the linear relationship between the randomly selected Darts portfolio and the Dow Jones Industrial Average (DJIA), from the Chapter 3 Case Study. (Note: This is for the entire data set, not the small sample taken in the Exercise 39 data set.)

Question 4.166
68. The net change in the DJIA ranged from −13.1% to 22.5%.
- Estimate the net price change for the Darts portfolio when the DJIA is up by 22%, if appropriate.
- Estimate the net price change for the Darts portfolio when the DJIA is down by 10%, if appropriate.
- Estimate the net price change for the Darts portfolio when the DJIA is down by 22%, if appropriate.