For Exercises 13–20, do the following for the indicated data set:
- Construct a scatterplot of the relationship between and .
- Interpret the scatterplot.
- Calculate the correlation coefficient .
- Interpret the value of the correlation coefficient .
Question 4.17
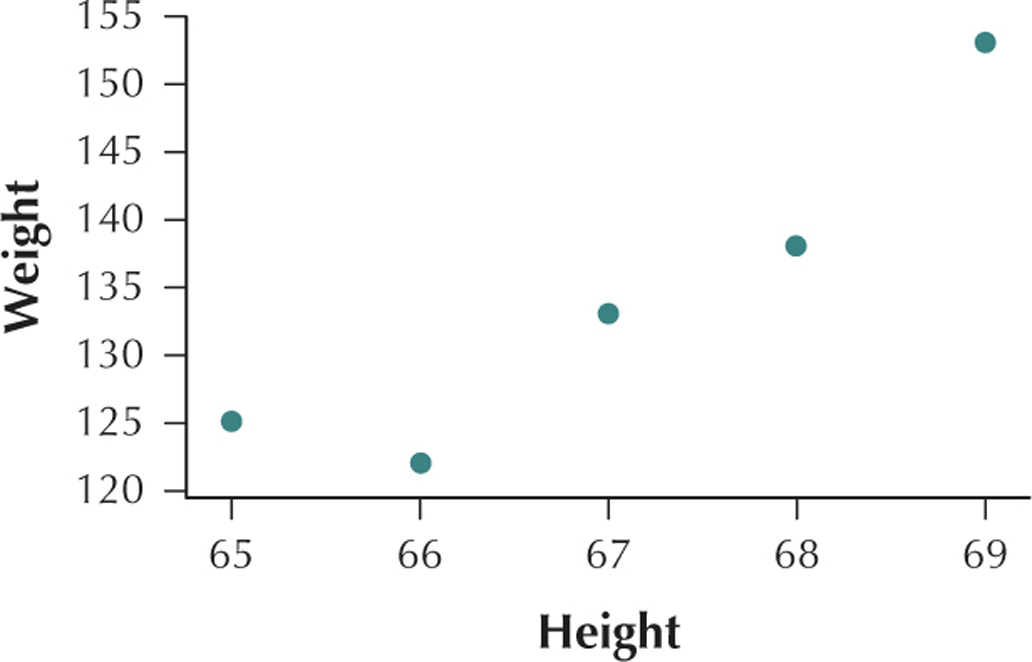
17. The heights (in inches) and weights (in pounds) of a sample of five women are recorded:
| Height | Weight |
|---|---|
| 66 | 122 |
| 67 | 133 |
| 69 | 153 |
| 68 | 138 |
| 65 | 125 |
4.1.17
(a)

(b) The variables height and weight have a positive linear relationship. (c) (d) This value of is very close to the maximum value .
We would therefore say that height and weight are positively correlated. As height increases, weight also tends to increase.