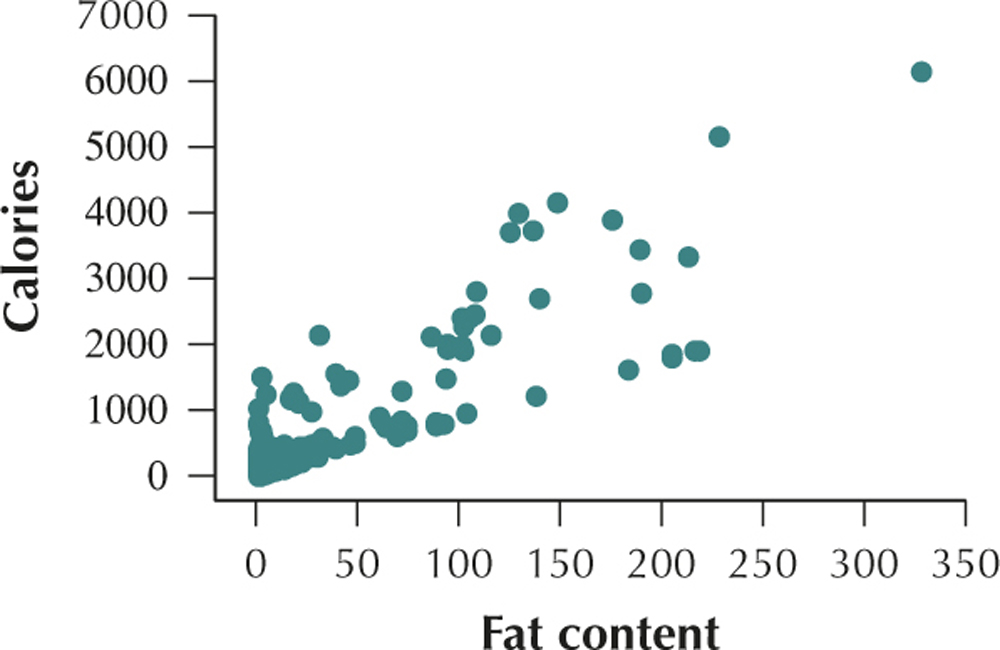
For Exercises 68–70, use technology and follow steps (a)–(e).
- Construct the scatterplot.
- Compute and interpret the regression equation.
- Calculate and interpret the coefficient of determination, .
- Compute and interpret , the standard error of the estimate.
- Find , using .
Question 4.270
nutrition
69. Open the nutrition data set. Let , and let .
4.3.69
(a)

(b) . The estimated calories per gram equals 8.12 times the amount of fat per gram, plus 1.28. (c) , so 73.6% of the variability in the number of calories per gram is accounted for by the linear relationship between calories per gram and fat per gram. (d) . The typical difference between the predicted number of calories per gram and the actual calories per gram is 0.9944. (e)