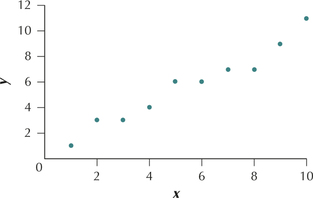
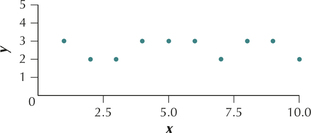
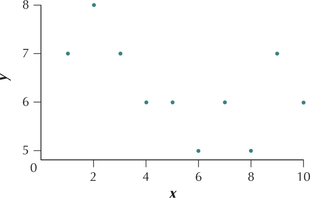
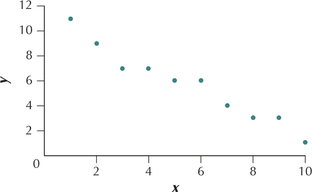
For Exercises 27–30, identify which of the scatterplots in i–iv represents the data set with the following correlation coefficients:
Question 4.30
30. Near −1
For Exercises 27–30, identify which of the scatterplots in i–iv represents the data set with the following correlation coefficients:


30. Near −1