For Exercises 35–49, do the following:
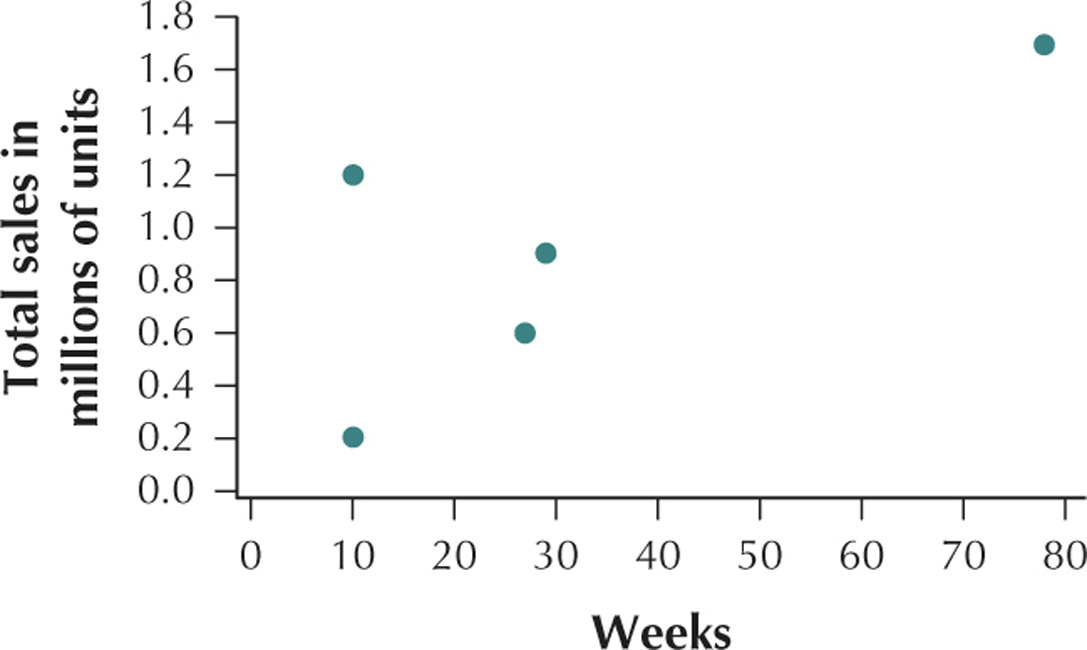
- Construct a scatterplot of the relationship between and .
- Interpret the scatterplot.
- Calculate the correlation coefficient .
- Interpret the value of the correlation coefficient .
Question 4.35
videogamereg
35. Video Game Sales. The Chapter 1 Case Study looked at video game sales for the top 30 video games. The following table contains the weeks on the top 30 list and the total sales (, in millions of game units).
| Video game | Weeks | Total sales in millions of units |
|---|---|---|
| Super Mario Bros. U for WiiU |
78 | 1.7 |
| NBA 2K14 for PS4 | 27 | 0.6 |
| Battlefield 4 for PS3 | 29 | 0.9 |
| Titanfall for Xbox One | 10 | 1.2 |
| Yoshi's New Island for 3DS |
10 | 0.2 |
Table 4.15: Source: www.vgchartz.com.
4.1.35
(a)

(b) The number of weeks on the top 30 list and the total sales in millions of game units have a positive linear relationship. (c) (d) This value of is close to the maximum value . We would therefore say that weeks and total sales are positively correlated. As the number of weeks on the top 30 lists increases, the total sales also tends to increase.