For Exercises 35–49, do the following:
- Construct a scatterplot of the relationship between and .
- Interpret the scatterplot.
- Calculate the correlation coefficient .
- Interpret the value of the correlation coefficient .
Question 4.37
dartsdjia
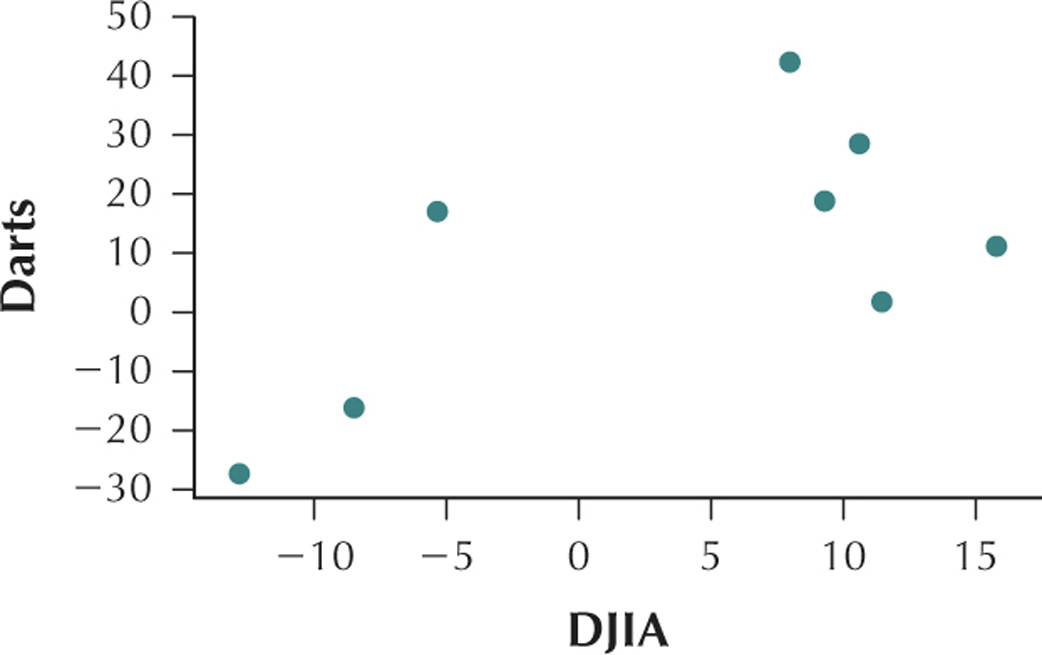
37. Darts and the Dow Jones. The following table contains a random sample of eight days from the Chapter 3 Case Study data set, indicating the stock market gain or loss for the portfolio chosen by the random darts , as well as the Dow Jones Industrial Average (DJIA) gain or loss for that day .
| Darts | DJIA |
|---|---|
| −27.4 | −12.8 |
| 18.7 | 9.3 |
| 42.2 | 8.0 |
| −16.3 | −8.5 |
| 11.2 | 15.8 |
| 28.5 | 10.6 |
| 1.8 | 11.5 |
| 16.9 | −5.3 |
4.1.37
(a)

(b) The change in price of the stocks in the DJIA and the change in price of the stocks in the portfolio selected by the darts have a positive linear relationship. (c) (d) This value of is close to the maximum value . We would therefore say that DJIA and Darts are positively correlated. As the change in stock prices of the stocks in the DJIA increases, the change in stock prices selected by darts also tends to increase.