For Exercises 35–49, do the following:
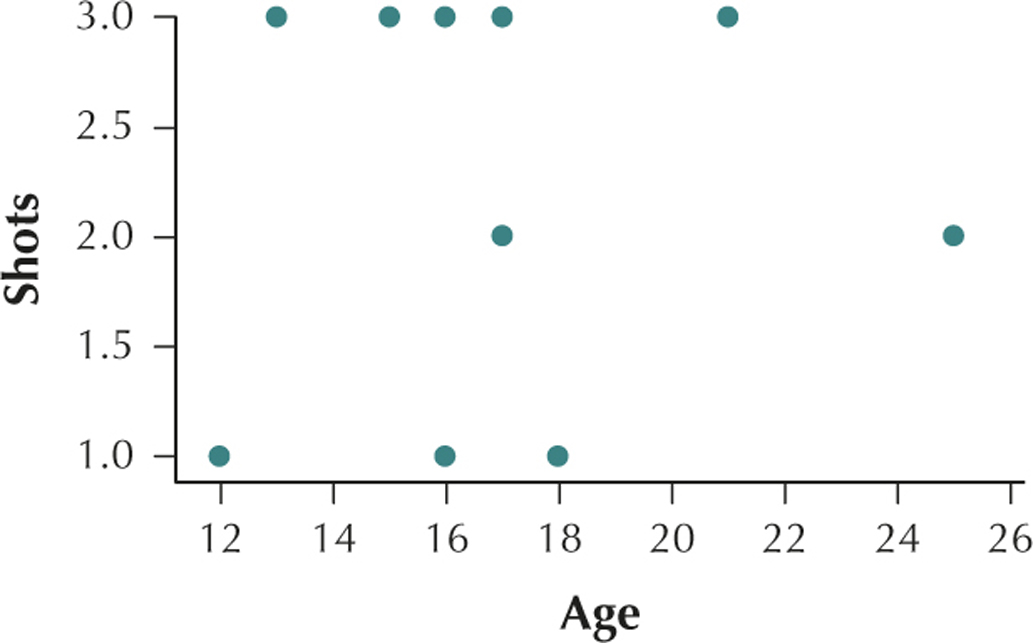
- Construct a scatterplot of the relationship between and .
- Interpret the scatterplot.
- Calculate the correlation coefficient .
- Interpret the value of the correlation coefficient .
Question 4.39
gardasilreg
39. Gardasil Shots and Age. The accompanying table shows a random sample of 10 patients from the Chapter 5 Case Study data set, Gardasil, including the age of the patient and the number of shots taken by the patient .
| Age | Shots |
|---|---|
| 13 | 3 |
| 21 | 3 |
| 16 | 3 |
| 17 | 2 |
| 17 | 3 |
| 18 | 1 |
| 25 | 2 |
| 15 | 3 |
| 12 | 1 |
| 16 | 1 |
Table 4.19: Source: Journal of Statistics Education.
4.1.39
(a)

(b) Age and number of shots have no apparent relationship. (c) (d) This value of is very close to the value . We would therefore say that there is no linear relationship between age and shots.