For Exercises 35–49, do the following:
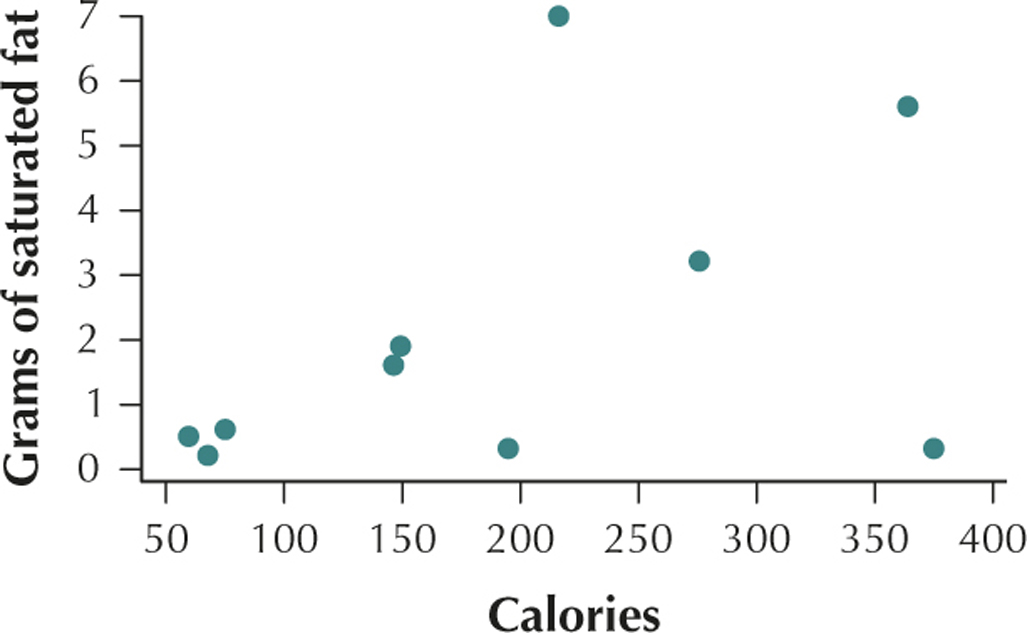
- Construct a scatterplot of the relationship between and .
- Interpret the scatterplot.
- Calculate the correlation coefficient .
- Interpret the value of the correlation coefficient .
Question 4.41
satfatcorr
41. Saturated Fat and Calories. The table contains the calories and saturated fat in a sample of 10 food items.
| Food item | Calories | Grams of saturated fat |
|---|---|---|
| Chocolate bar (1.45 ounces) | 216 | 7.0 |
| Meat & veggie pizza (large slice) |
364 | 5.6 |
| New England clam chowder (1 cup) |
149 | 1.9 |
| Baked chicken drumstick (no skin, medium size) |
75 | 0.6 |
| Curly fries, deep-fried (4 ounces) |
276 | 3.2 |
| Wheat bagel (large) | 375 | 0.3 |
| Chicken curry (1 cup) | 146 | 1.6 |
| Cake doughnut hole (one) | 59 | 0.5 |
| Rye bread (1 slice) | 67 | 0.2 |
| Raisin bran cereal (1 cup) | 195 | 0.3 |
Table 4.21: Source: Food-a-Pedia.
4.1.41
(a)

(b) The number of calories in a serving of food and the grams of saturated fat in a serving of food have a positive linear relationship. (c) (d) This value of is positive. We would therefore say that the number of calories in a serving of food and the grams of saturated fat in a serving of food are positively correlated. As the number of calories in a serving of food increases, the grams of saturated fat in a serving of food also tends to increase.