For Exercises 35–49, do the following:
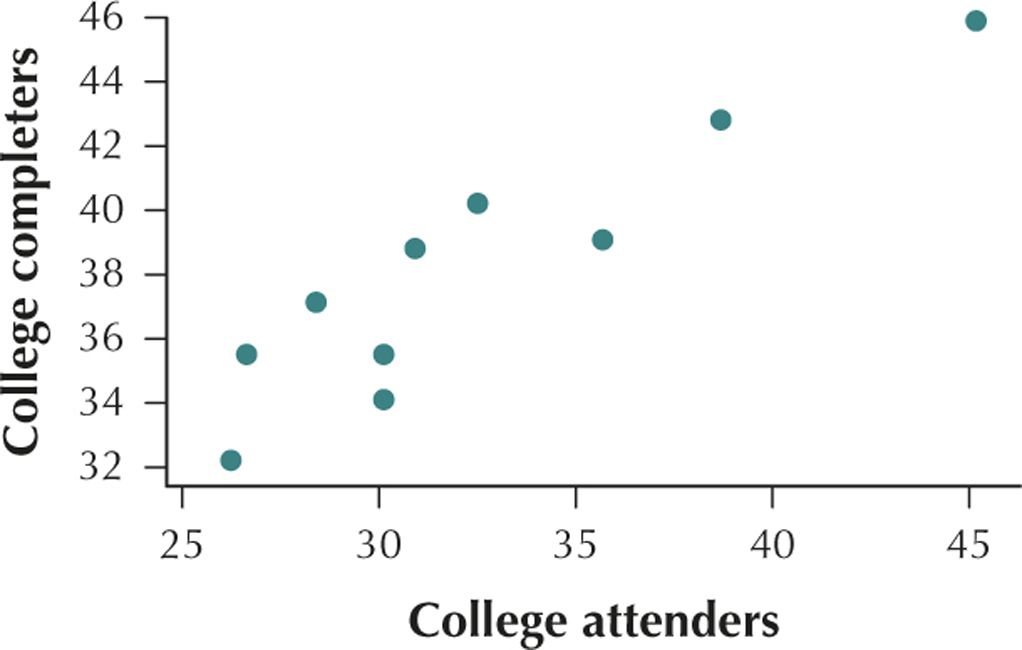
- Construct a scatterplot of the relationship between and .
- Interpret the scatterplot.
- Calculate the correlation coefficient .
- Interpret the value of the correlation coefficient .
Question 4.43
collegecompleters
43. Completing College. The twenty-first century economy not only needs students to attend college; it needs students to complete their college degrees, in order to compete in the information age. The table contains a sample of 10 states, with data on the percentage of residents who have attended college and the percentage of college attendees who have completed their college degrees .
| State | ||
|---|---|---|
| California | 30.9 | 38.8 |
| Florida | 26.6 | 35.5 |
| Georgia | 30.1 | 34.1 |
| Illinois | 35.7 | 39.1 |
| Massachusetts | 45.2 | 45.9 |
| New York | 38.7 | 42.8 |
| North Carolina | 30.1 | 35.5 |
| Ohio | 28.4 | 37.1 |
| Pennsylvania | 32.5 | 40.2 |
| Texas | 26.2 | 32.2 |
4.1.43
(a)

(b) The percent of residents of a state who attend college and the percent of residents of a state who graduate from college have a positive linear relationship. (c) (d) This value of is very close to the maximum value . We would therefore say that college attenders and college completers are positively correlated. As the number of college attenders increases, the number of college completers also tends to increase.