For Exercises 35–49, do the following:
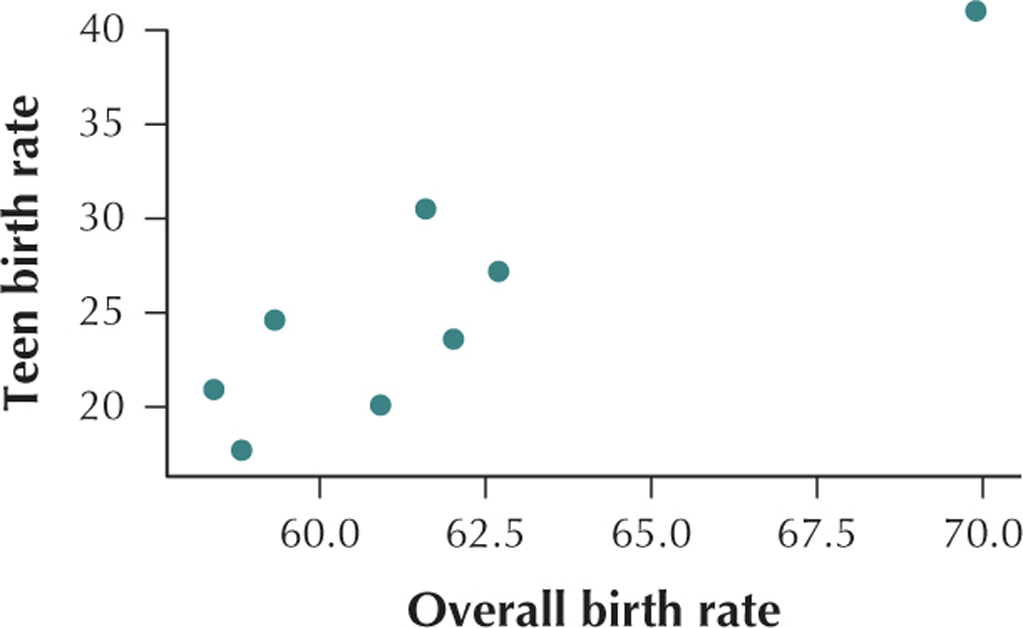
- Construct a scatterplot of the relationship between and .
- Interpret the scatterplot.
- Calculate the correlation coefficient .
- Interpret the value of the correlation coefficient .
Question 4.45
teenbirth
45. Teenage Birth Rate. The National Center for Health Statistics publishes data on state birth rates. The table contains the overall birth rate and the teenage birth rate for eight randomly chosen states. The overall birth rate is defined by the NCHS as “live births per 1000 women,” and the teenage birth rate is defined as “live births per 1000 women aged 15–19.”
205
| State | ||
|---|---|---|
| California | 62.0 | 23.6 |
| Florida | 59.3 | 24.6 |
| Georgia | 61.6 | 30.5 |
| New York | 58.8 | 17.7 |
| Ohio | 62.7 | 27.2 |
| Pennsylvania | 58.4 | 20.9 |
| Texas | 69.9 | 41.0 |
| Virginia | 60.9 | 20.1 |
4.1.45
(a)

(b) The overall birth rate and the teenage birth rate have a positive linear relationship. (c) (d) This value of is very close to the maximum value . We would therefore say that overall birth rate and teen birth rate are positively correlated. As the overall birth rate increases, the teen birth rate also tends to increase.