For Exercises 35–49, do the following:
- Construct a scatterplot of the relationship between and .
- Interpret the scatterplot.
- Calculate the correlation coefficient .
- Interpret the value of the correlation coefficient .
Question 4.47
consumersentiment
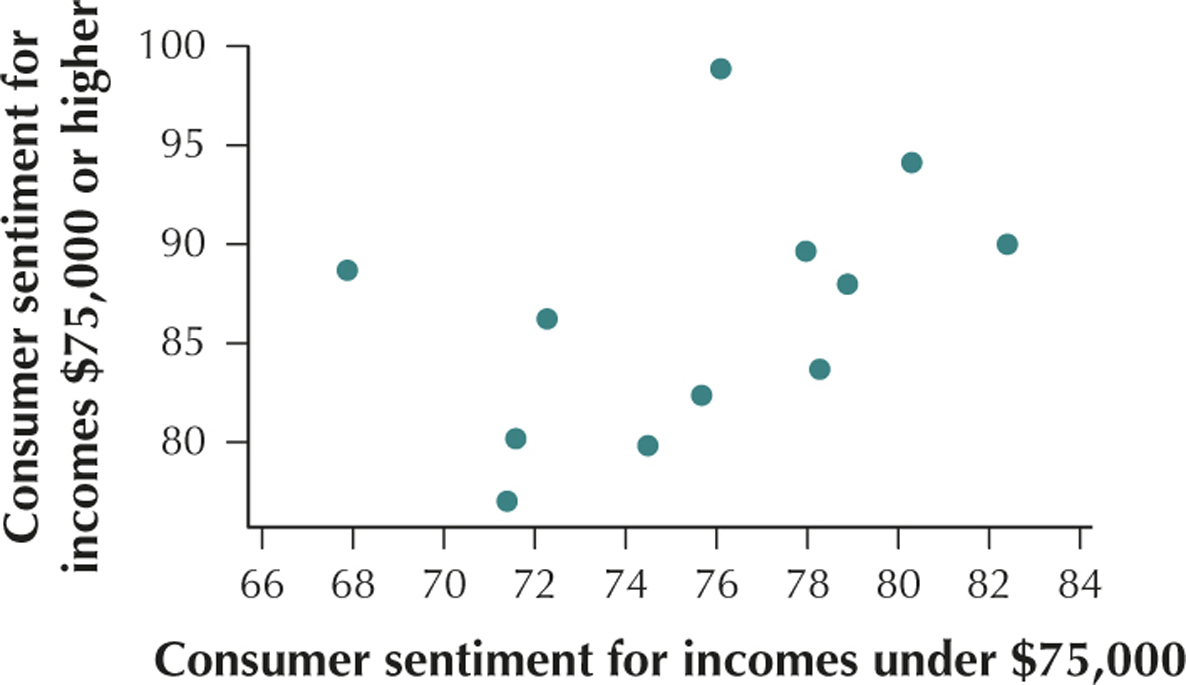
47. Consumer Sentiment. Would you expect the consumer sentiment (a measure of how upbeat a consumer feels about his or her personal economic condition) of those with lower incomes to be correlated with that of those with higher incomes, over time? The University of Michigan's Survey of Consumers published the data in the following table, showing the consumer sentiment in 2013 month by month for the two groups.
| Month | ||
|---|---|---|
| Jan | 71.6 | 80.2 |
| Feb | 75.7 | 82.4 |
| Mar | 78.3 | 83.7 |
| Apr | 74.5 | 79.8 |
| May | 80.3 | 94.1 |
| Jun | 76.1 | 98.9 |
| Jul | 82.4 | 90.0 |
| Aug | 78.0 | 89.6 |
| Sep | 72.3 | 86.2 |
| Oct | 71.4 | 77.0 |
| Nov | 67.9 | 88.7 |
| Dec | 78.9 | 88.0 |
4.1.47
(a)

(b) The consumer sentiment for incomes under $75,000 and the consumer sentiment for incomes $75,000 or higher have a positive linear relationship. (c) (d) This value of is positive. We would therefore say that the consumer sentiment for incomes under $75,000 and the consumer sentiment for incomes $75,000 or higher are positively correlated. As the consumer sentiment for incomes under $75,000 increases, the consumer sentiment for incomes $75,000 or higher also tends to increase.