Best Places for Dating. Sperling's Best Places published the list of best places for dating in America. The table shows the top 10 places, along with the overall dating score and a set of predictor variables. Use this information for Exercises 57–59.
| City | Percentage 18–24 years old |
Percentage 18–24 who are single |
Online dating score |
|
|---|---|---|---|---|
| Austin | 100.0 | 13.4% | 81.2% | 77.8 |
| Colorado Springs |
88.7 | 10.5% | 74.2% | 88.9 |
| San Diego | 84.0 | 11.3% | 79.4% | 77.4 |
| Raleigh | 80.7 | 11.6% | 82.9% | 79.2 |
| Seattle | 78.7 | 9.0% | 83.9% | 100.0 |
| Charleston | 78.7 | 11.2% | 82.7% | 66.9 |
| Norfolk | 77.0 | 11.2% | 75.6% | 82.9 |
| Ann Arbor | 75.5 | 12.9% | 90.3% | 51.1 |
| Springfield | 75.2 | 11.7% | 89.8% | 63.5 |
| Honolulu | 75.2 | 10.1% | 82.3% | 50.2 |
Question 4.57
bestdating
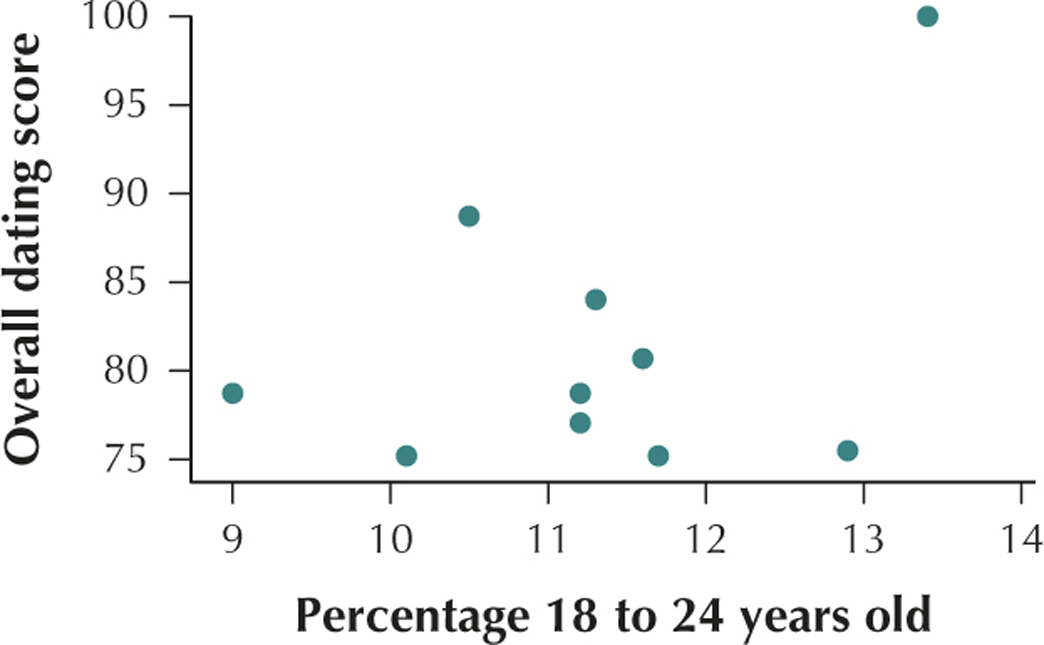
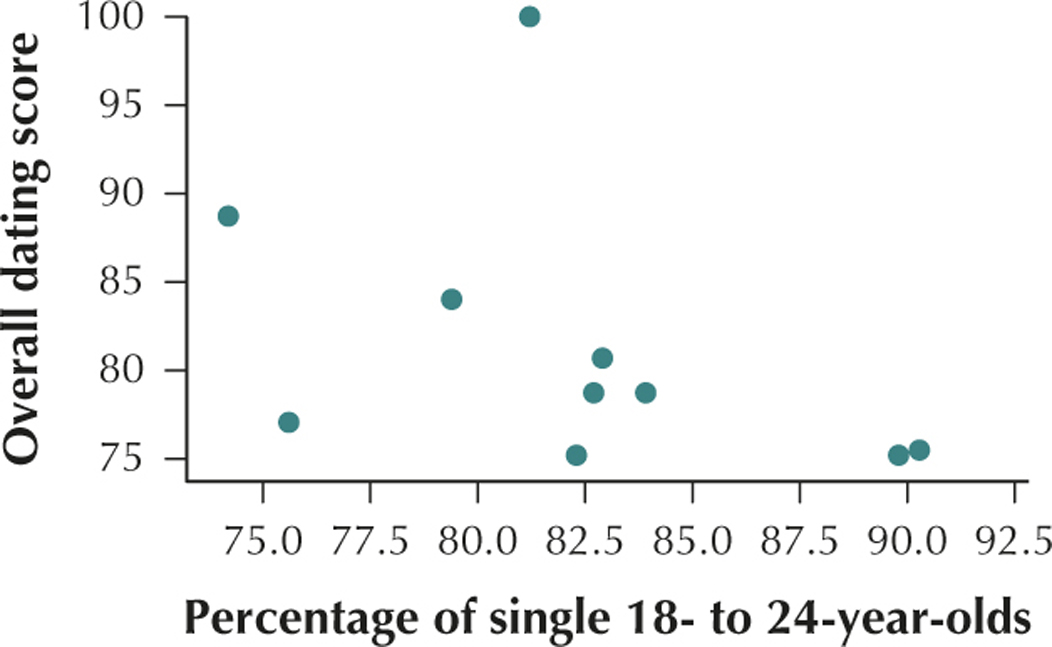
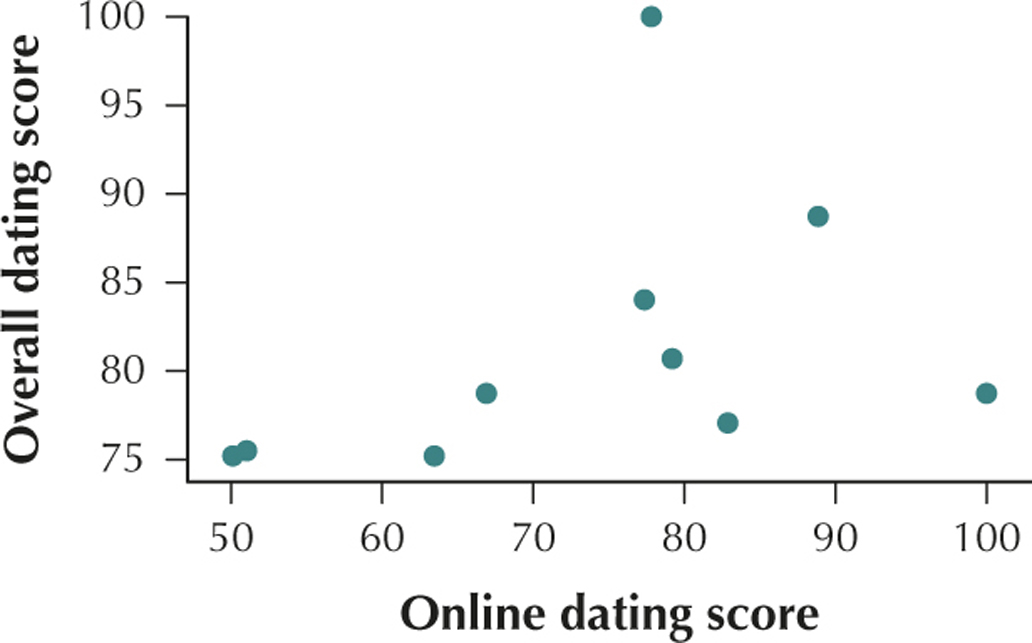
57. Construct and interpret a scatterplot for each of the following predictor variables versus the overall dating score:
- Percentage 18–24 years old
- Percentage 18–24 years old who are single
- Online dating score
4.1.57
(a)

The percentage of 18- to 24-year-olds in a city and the overall dating score in a city have a positive linear relationship.
(b)

The percentage of a city's residents who are 18- to 24-year-olds and single and the overall dating score of a city have a negative linear relationship.
(c)

The online dating score of a city and the overall dating score of a city have a positive linear relationship.