EXAMPLE 9 Simulating the long-term proportion of 6s in a fair die roll
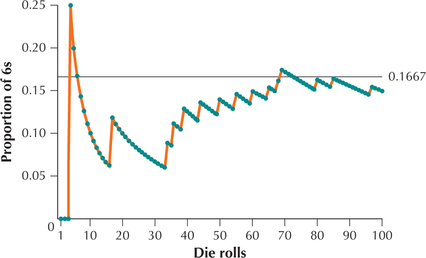
Suppose we want to investigate the proportion of 6s we observe if we roll a fair die 100 times. We can use technology, such as the TI-83/84 used here, to help us simulate rolling a fair die a large number of times. A simulation uses methods such as rolling dice or computer generation of random numbers to generate results from an experiment. The actual die rolls from our simulation are shown here, in order, with the 6s in boldface.
| 1 4 4 6 2 4 3 2 1 3 4 3 3 4 3 3 6 3 5 5 1 5 3 5 5 2 1 3 1 1 1 5 5 6 3 6 2 1 6 5 5 4 4 6 5 4 1 1 4 6 |
| 4 2 2 2 6 3 2 5 5 6 1 1 3 1 6 5 4 6 6 5 5 5 2 5 5 3 4 2 4 6 4 5 5 1 6 3 1 1 1 3 5 4 2 3 3 3 6 2 5 3 |
Thus, the first die roll was a 1, so the proportion of 6s was . The second and third die rolls were 4s, so the proportion of 6s after 3 rolls was . On the fourth roll, a 6 appeared, so the proportion of 6s after the fourth roll was . Figure 4 provides a graph of the proportion of 6s in this simulation as the number of die rolls increased. Note that as the number of die rolls increases, the proportion of 6s tends to get closer to the horizontal line: .

249
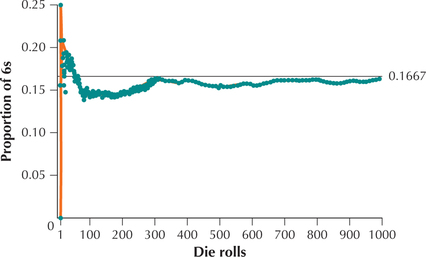
The simulation was rerun—this time with 1000 die rolls. The resulting graph of the proportion of 6s is provided in Figure 5. Note that as the number of die rolls increases, the proportion of 6s approaches the line , and the fit is tighter with 1000 die rolls than with 100. This is what we mean by “long-term proportion.”
