EXAMPLE 12-score method for determining an unusual value
- Using the information from Example 11, determine whether is an unusual number of credits to take this semester.
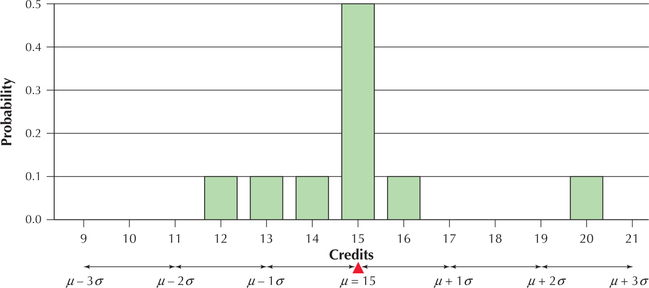
- Construct a probability distribution graph of , illustrating how credits is moderately unusual.
Solution
Recall from Section 3.4 (page 159) that a data value with a -score between 2 and 3 may be considered moderately unusual. The -score for credits is
Thus, among Carla's friends, it would be considered moderately unusual to take 20 credits this semester.
- Figure 4 shows the probability distribution graph of . The mean is indicated, along with the distances , , .
 Figure 6.5: FIGURE 4 credits is moderately unusual because it lies standard deviations above the mean.
NOW YOU CAN DO
Exercises 53c–60c.